The four tabs
| Tab | What it shows |
|---|---|
| Overview | The big picture: KPIs, share of shelf, retailers, your products vs competitors, competitive landscape |
| Prompts | Per-prompt × per-model analytics. How each prompt performs across each AI surface |
| Sources | Websites and sub-queries used by the AI assistants to produce their answers |
| Setup | Where you manage groups and prompts |
Step 1 : Set up a group (4-step wizard)
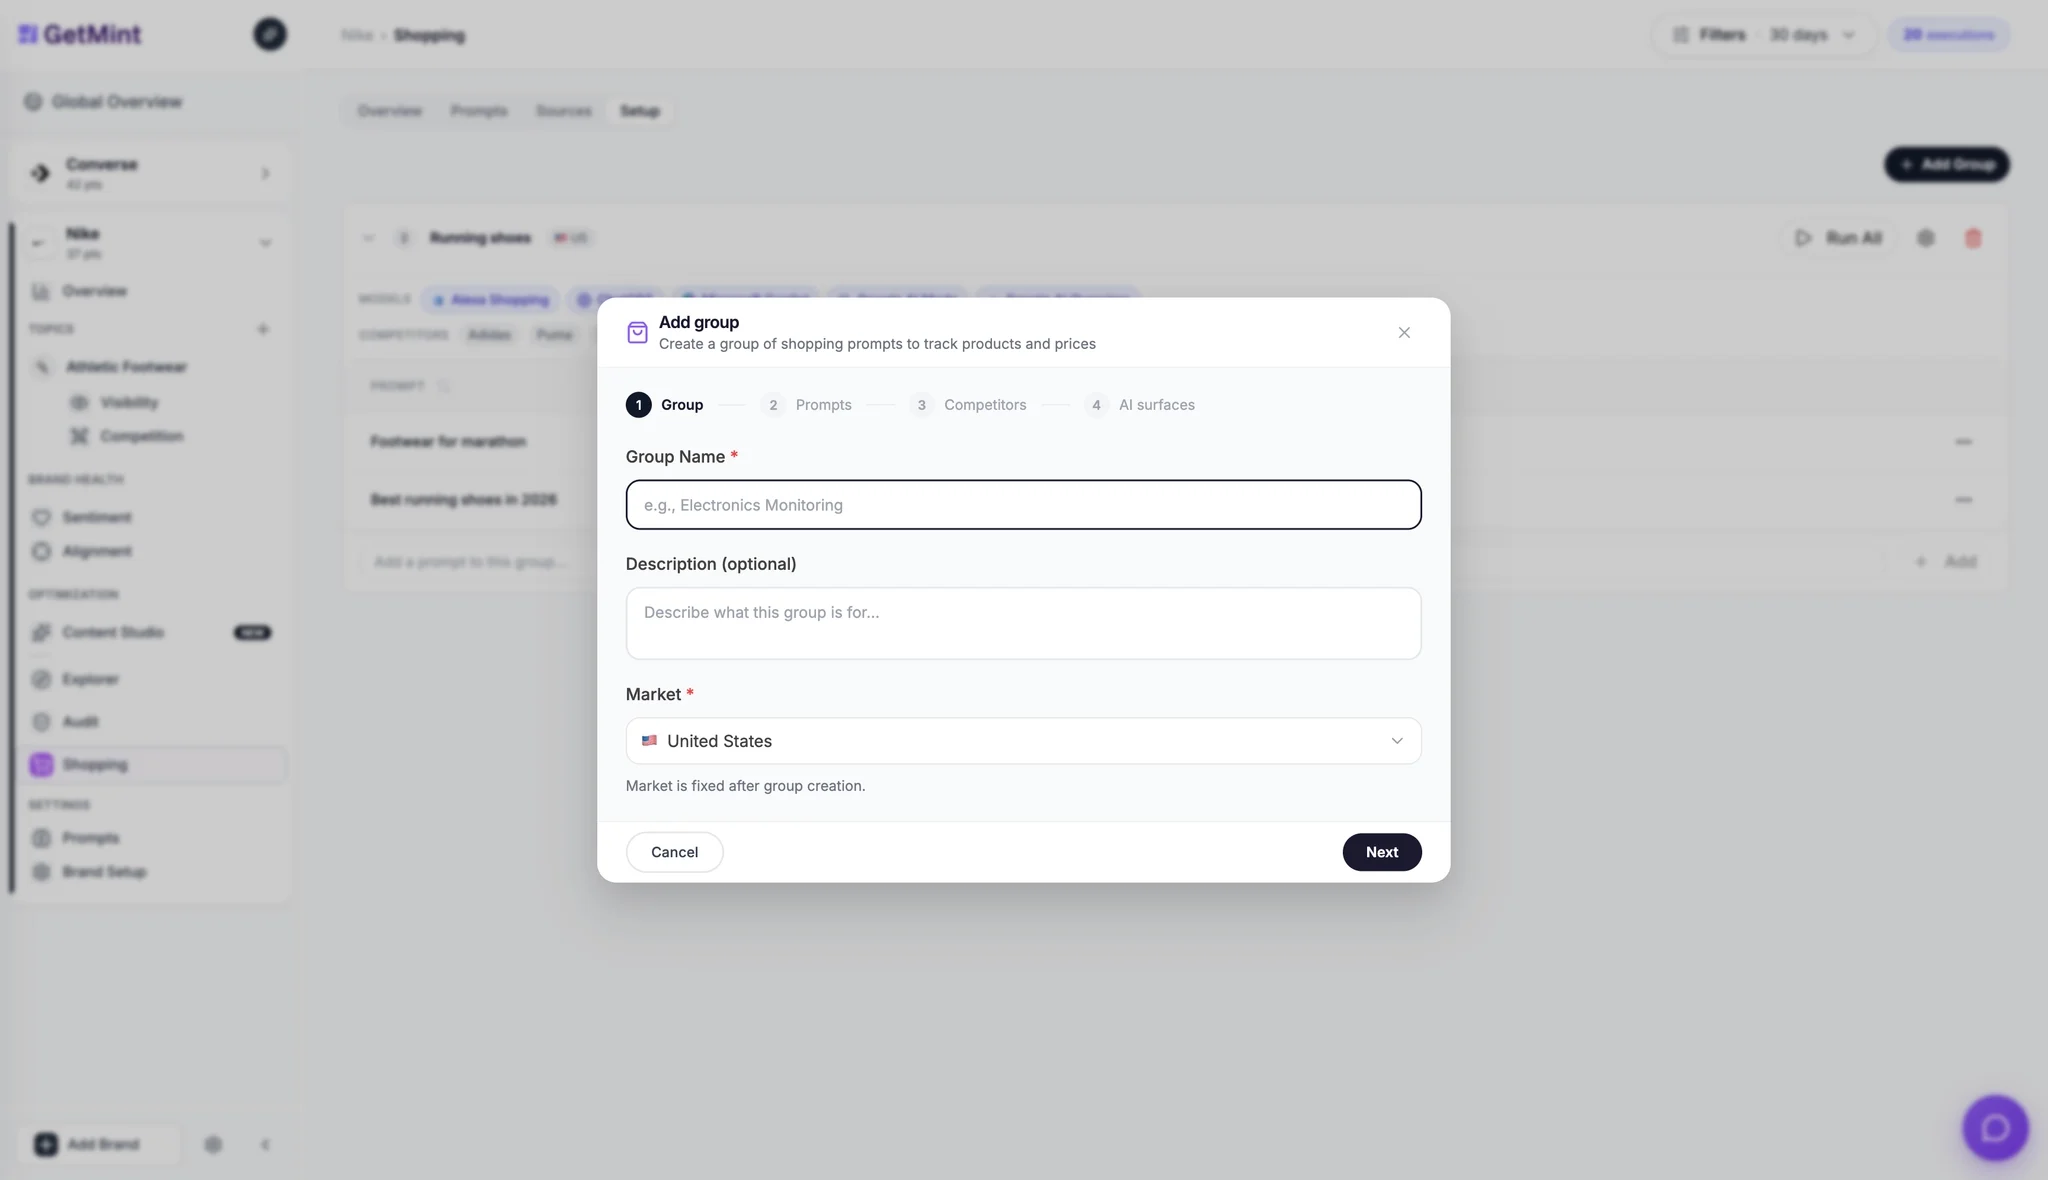
Creating data in Shopping starts with a group. Groups gather prompts that share the same market, competitors and AI surfaces. The wizard guides you through: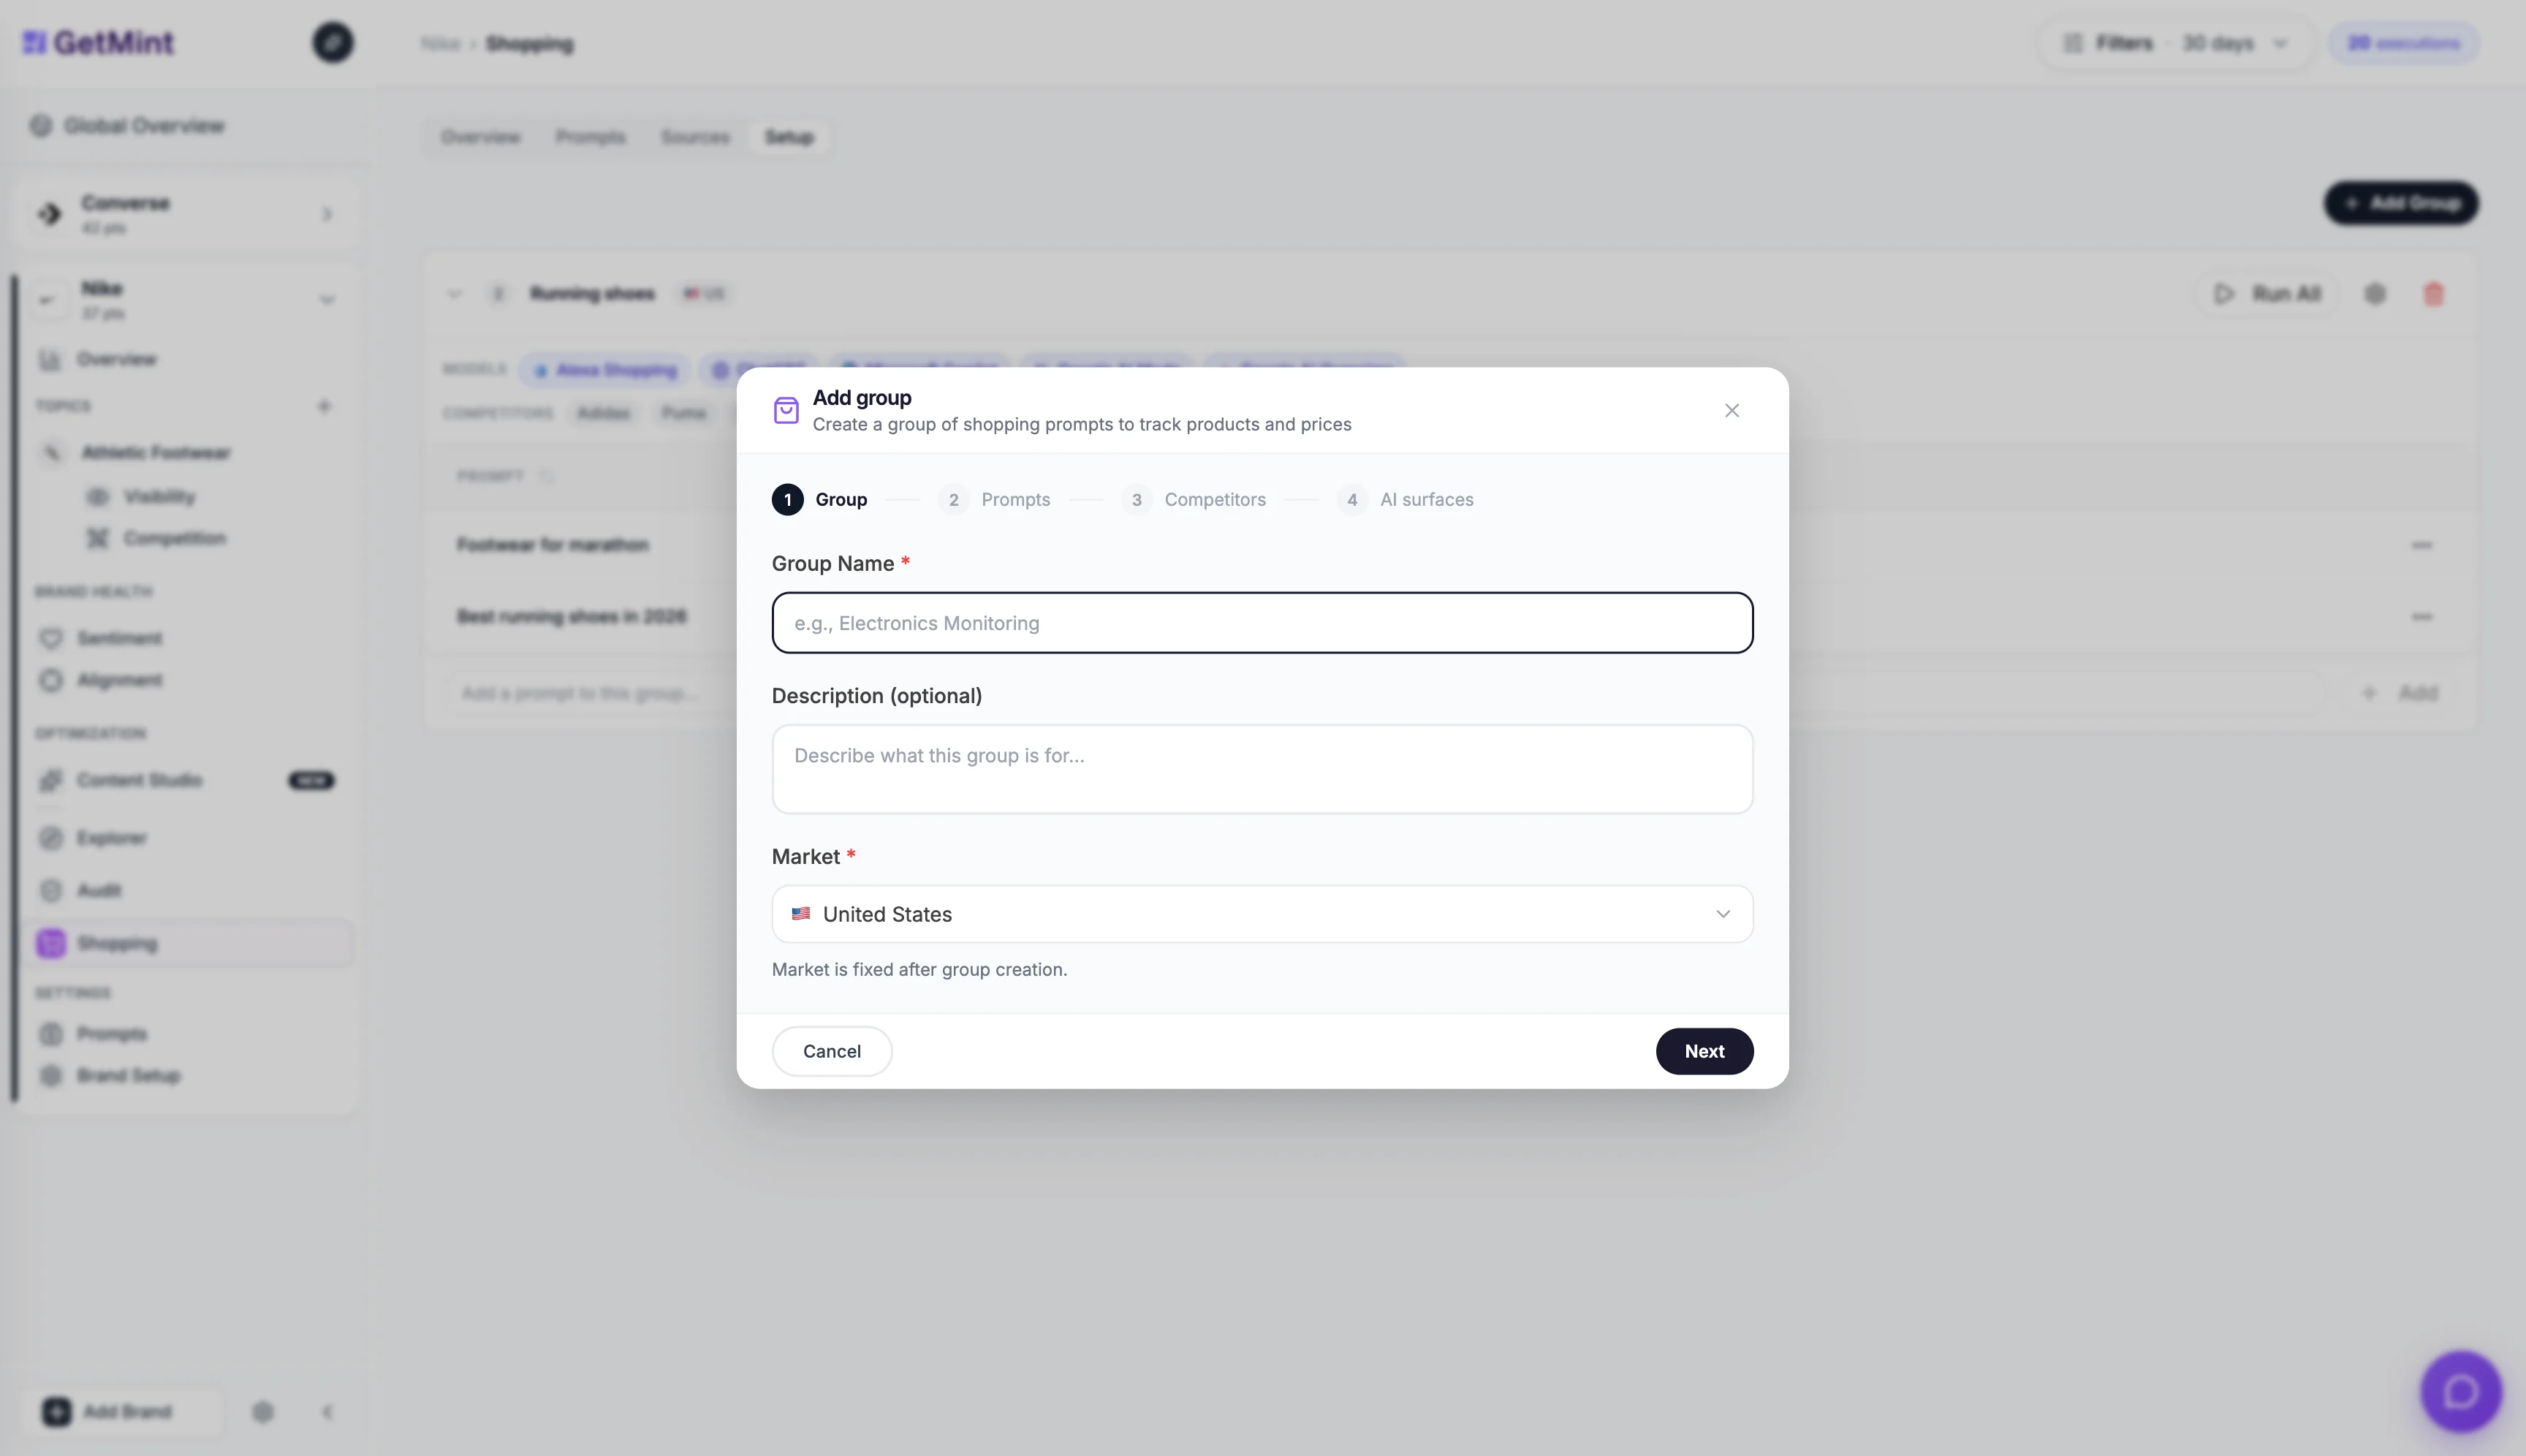
Step 1 : Group
Give the group a name (e.g. “Marathon Shoes”), an optional description, and pick the market (country + language are inferred from the country choice).Step 2 — Prompts
Add the buying questions you want to monitor. Type them one per line, or upload a CSV to bulk-import.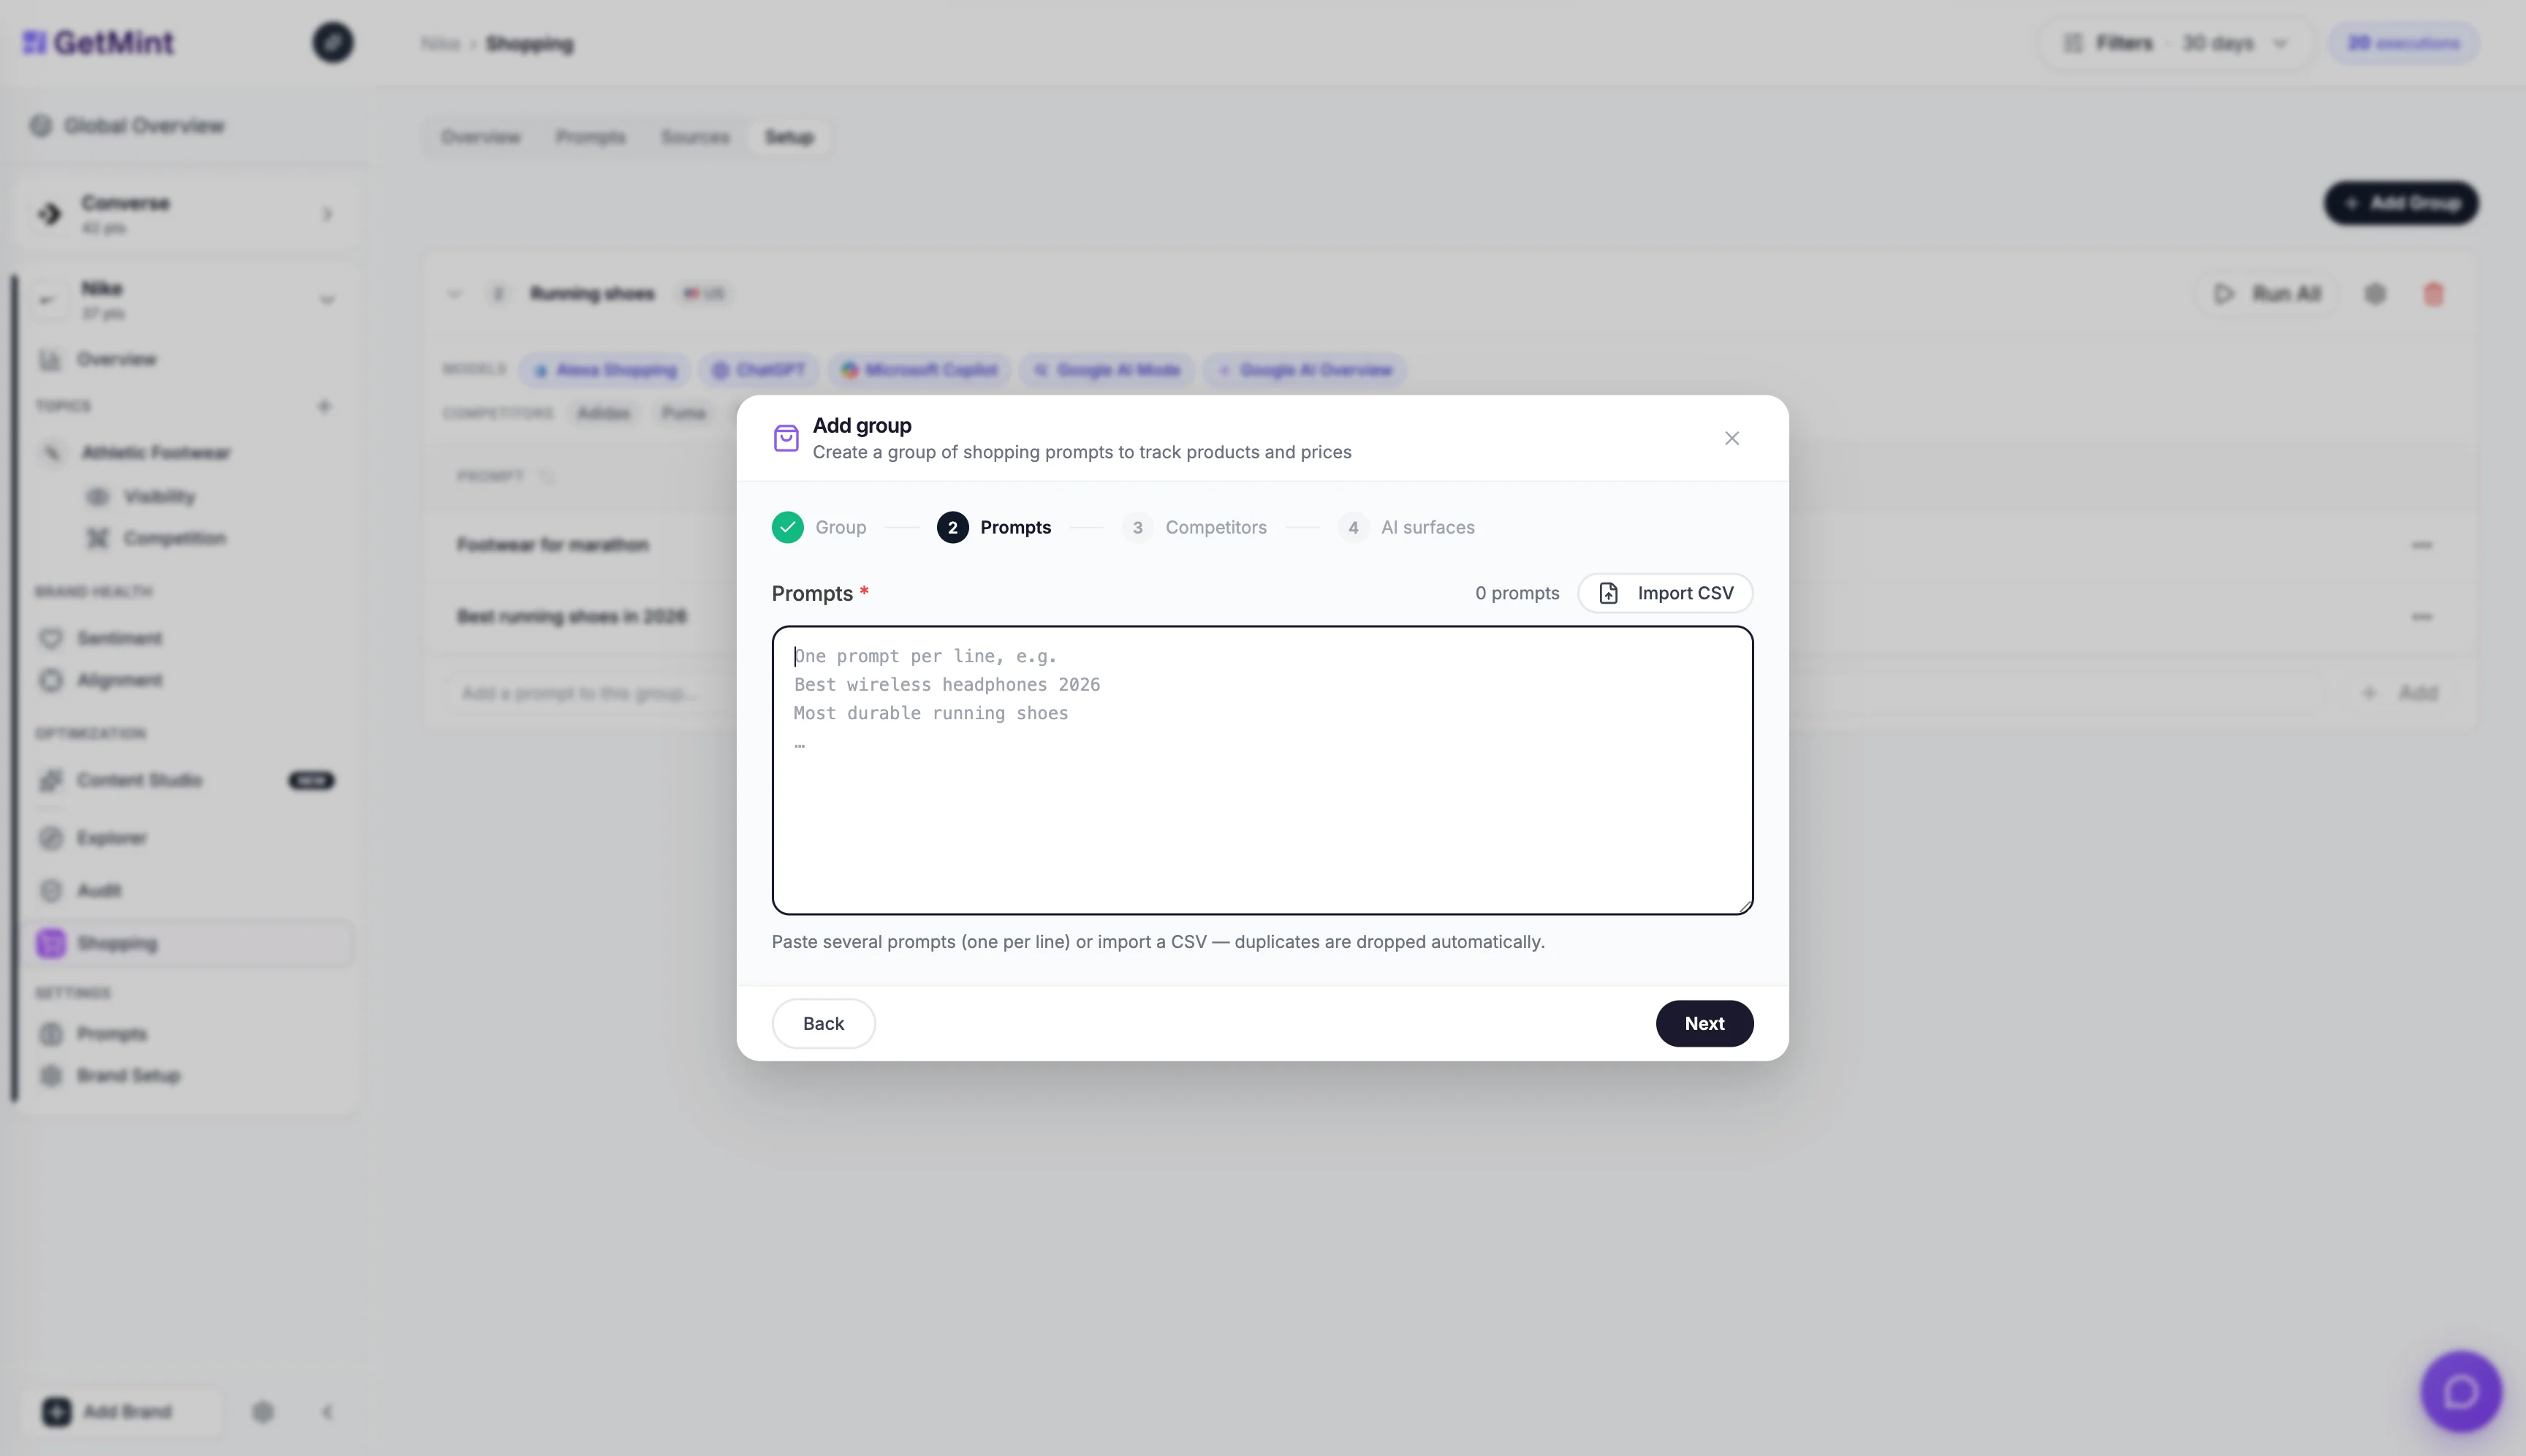
Step 3 — Competitors
Declare the competitor brands you want to track against. They become the “vs” reference in every chart and table downstream. GetMint can pre-suggest competitors based on your domain.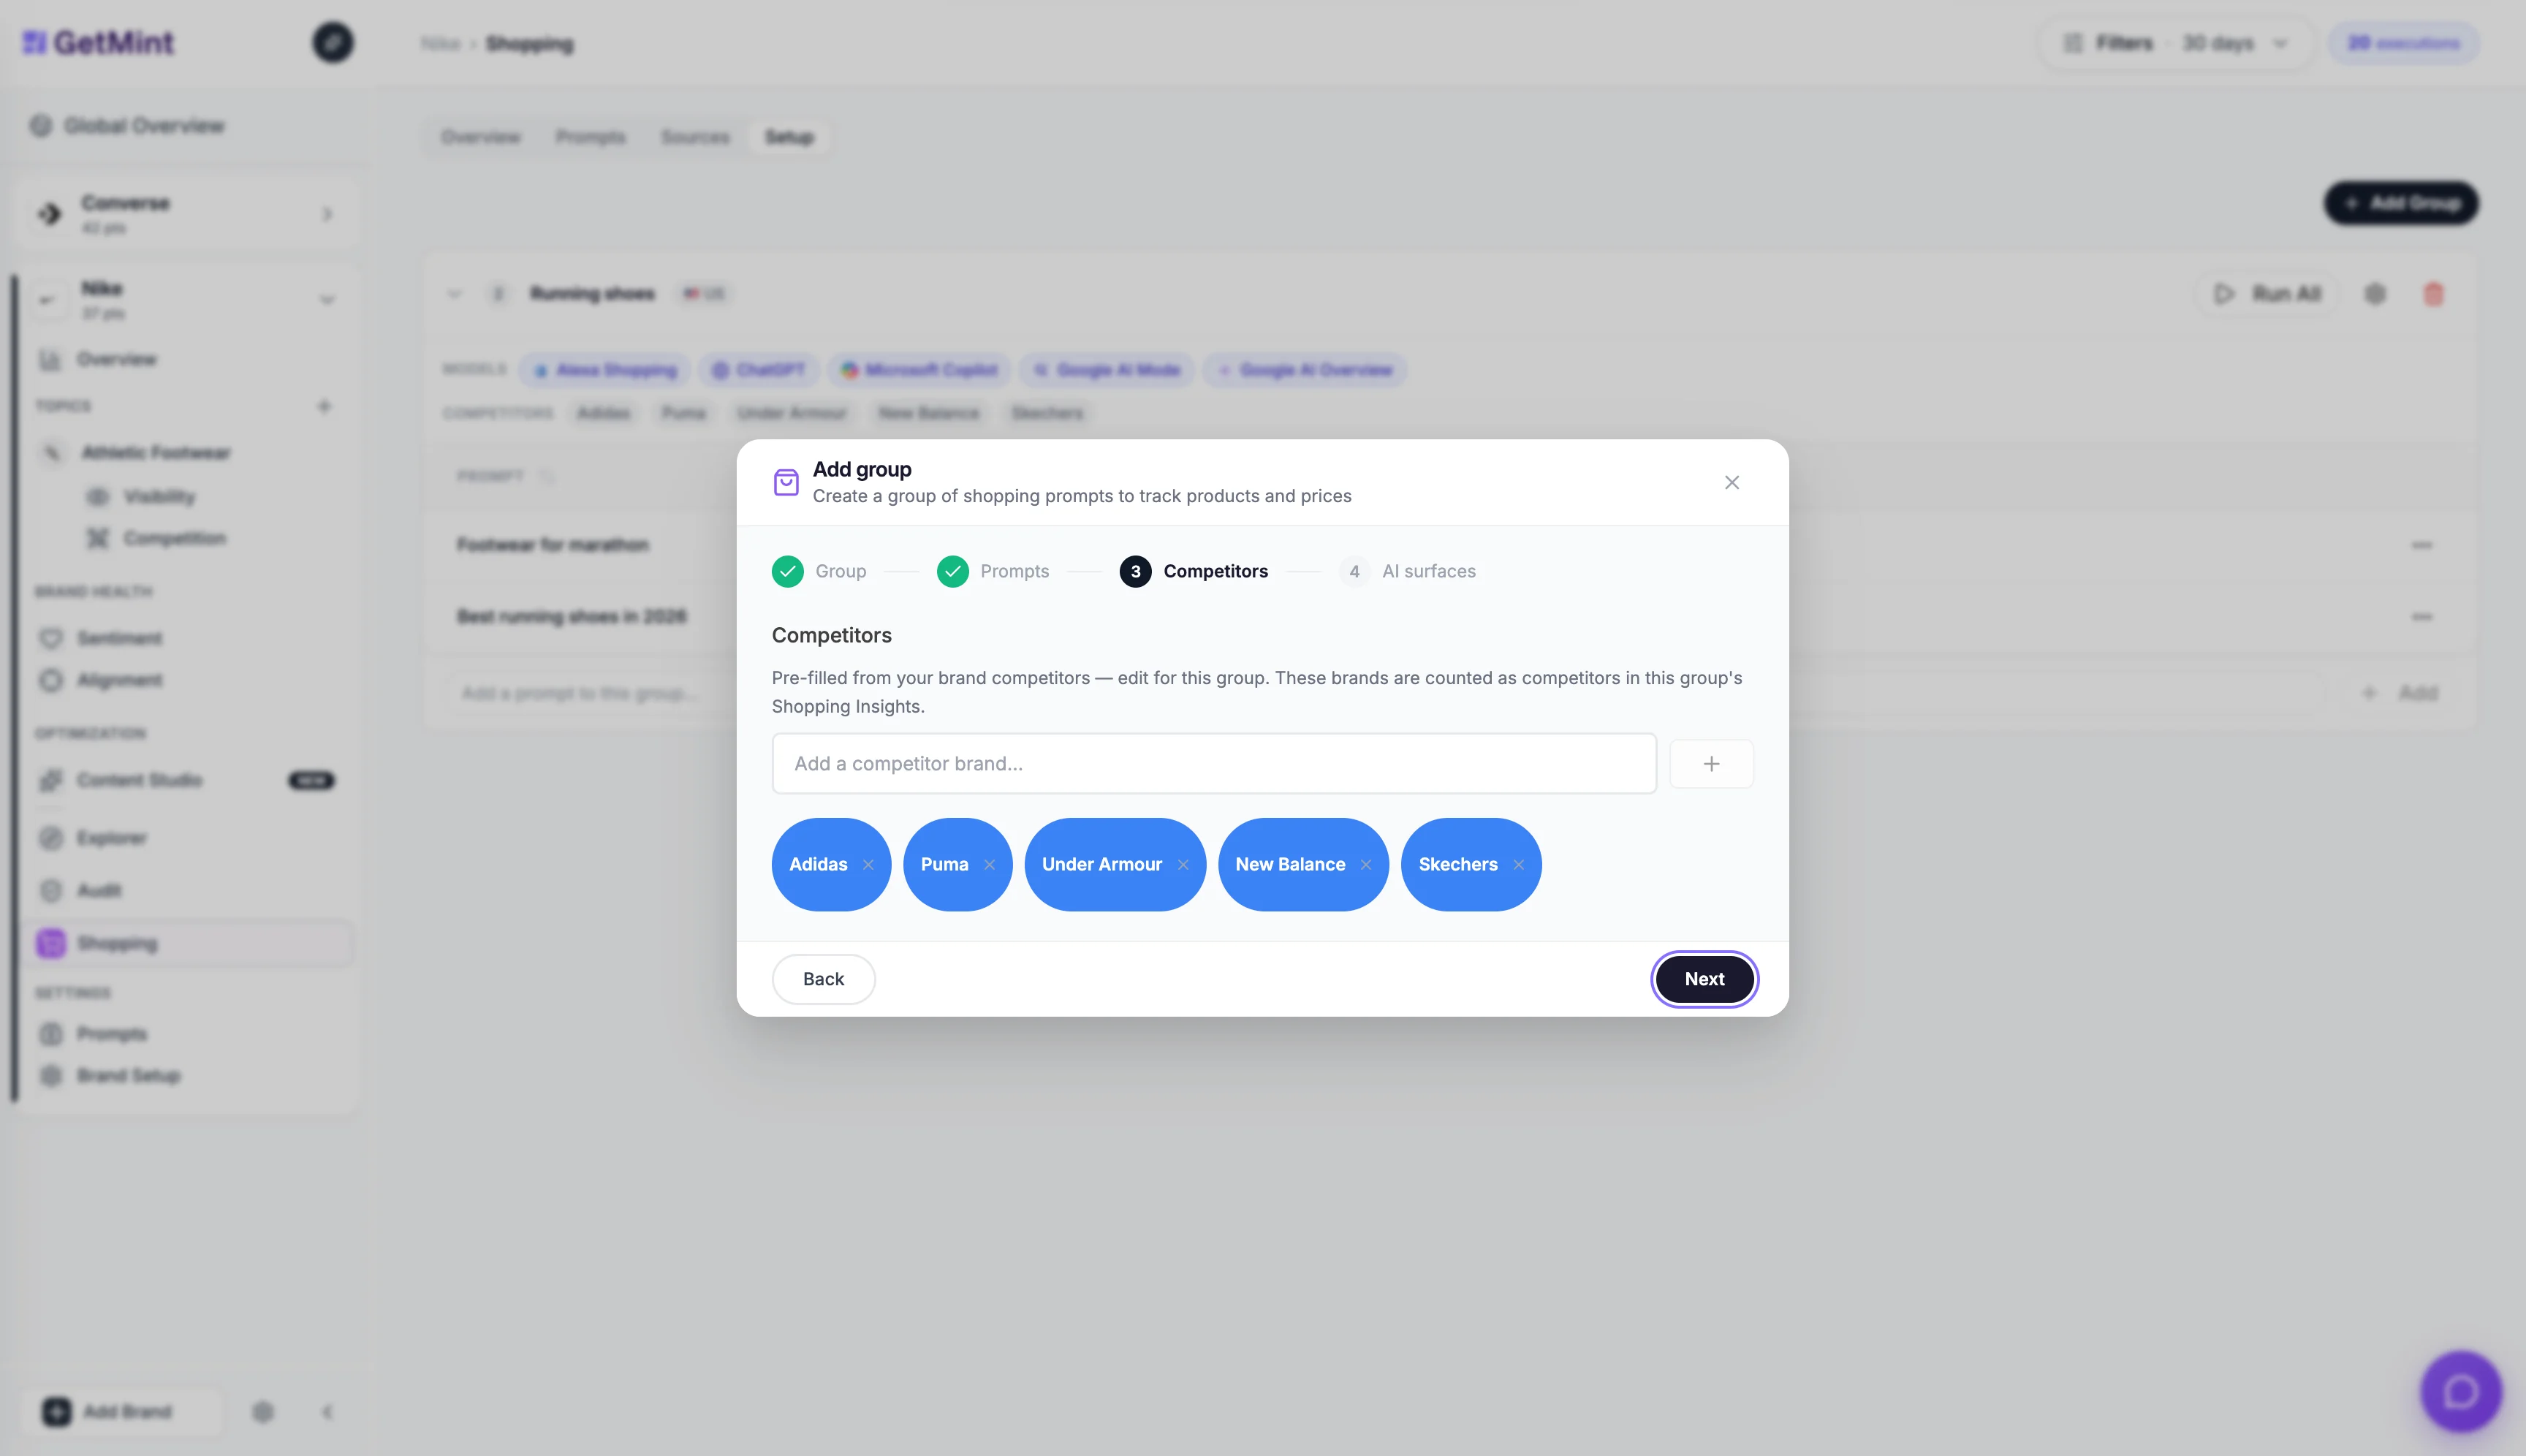
Step 4 — AI surfaces
Pick the AI assistants the prompts should be run against. You can select several at once. Each surface counts against your organisation’s prompt limits..png?fit=max&auto=format&n=FQE6sO18xZ6RvVsJ&q=85&s=8e69b71122e1f6e9dd66a36df0b4fcf9)
Step 2 — Read the Overview
The Overview tab is the first thing you’ll open every Monday morning. It’s organised as a single scrolling dashboard.1. KPI row
Top of the page. A handful of headline numbers with trend indicators (up/down/stable vs previous period).2. Share of Shelf
A donut showing how the category is split between your brand and the competitors you declared. Toggle to a trend chart to see how that share moves over time..png?fit=max&auto=format&n=FQE6sO18xZ6RvVsJ&q=85&s=bf82243993c6b5782dca4588b721b79c)
3. Top Merchants chart
Retailer share — which marketplaces and shops show up most often in AI answers (Amazon, Best Buy, Wayfair, niche e-commerce, etc.)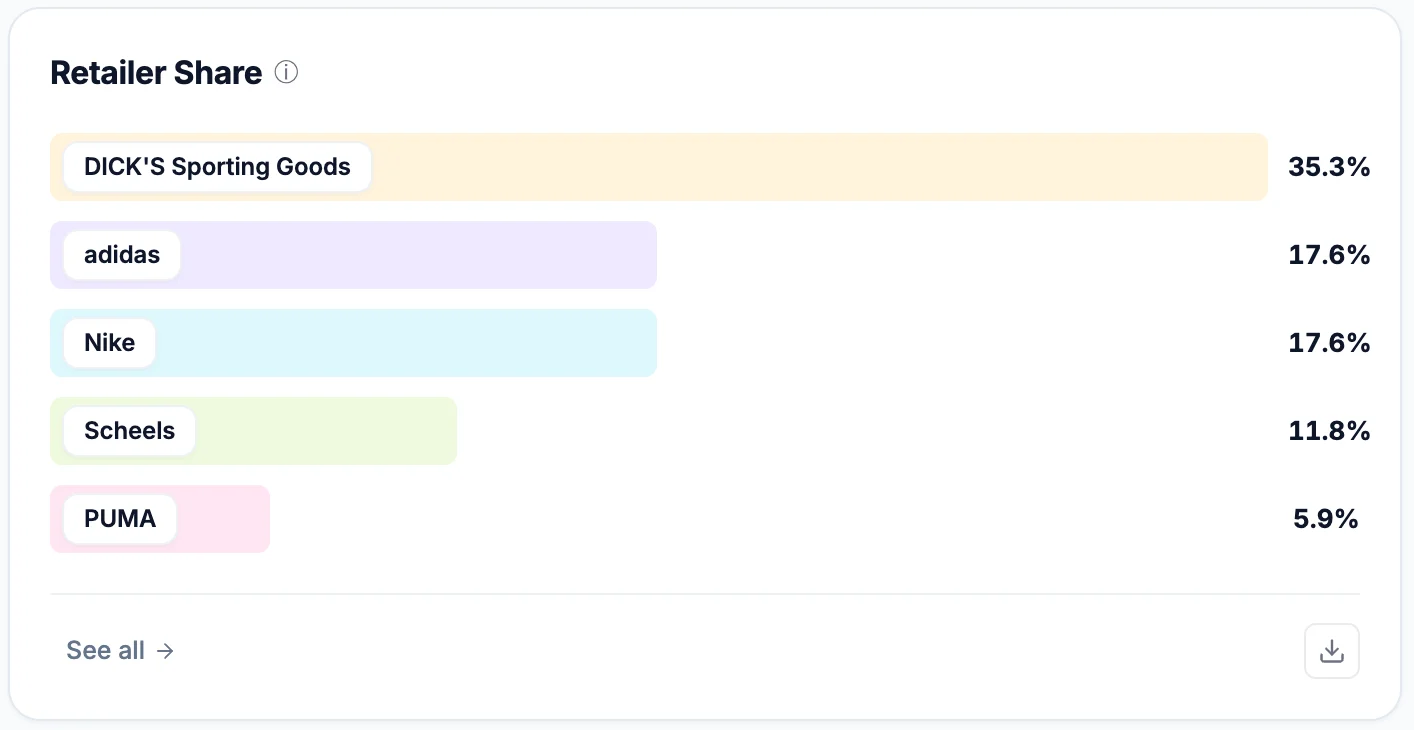
4. Top Offer Merchants table
A full-width table ranking the merchants that hosted offers cited by the AI, with the number of products and offers.5. Your Top Products / Competitor Products
Two side-by-side tables. On the left, your most-surfaced products with average rank, rating (and rating trend) and price. On the right, the same view for competitor products.6. Competitive Landscape chart
A trend chart plotting your brand and your competitors over time on the same axis. Lets you see who’s gaining or losing share at a glance.Export to CSV
Every table on Overview has a CSV export button so you can ship the data into your own reporting tools or send it to clients.Step 3 — Drill into Prompts (analytics)
The Prompts tab is no longer a list of prompts to manage — that moved to Setup. The tab is now a per-prompt × per-model analytics table.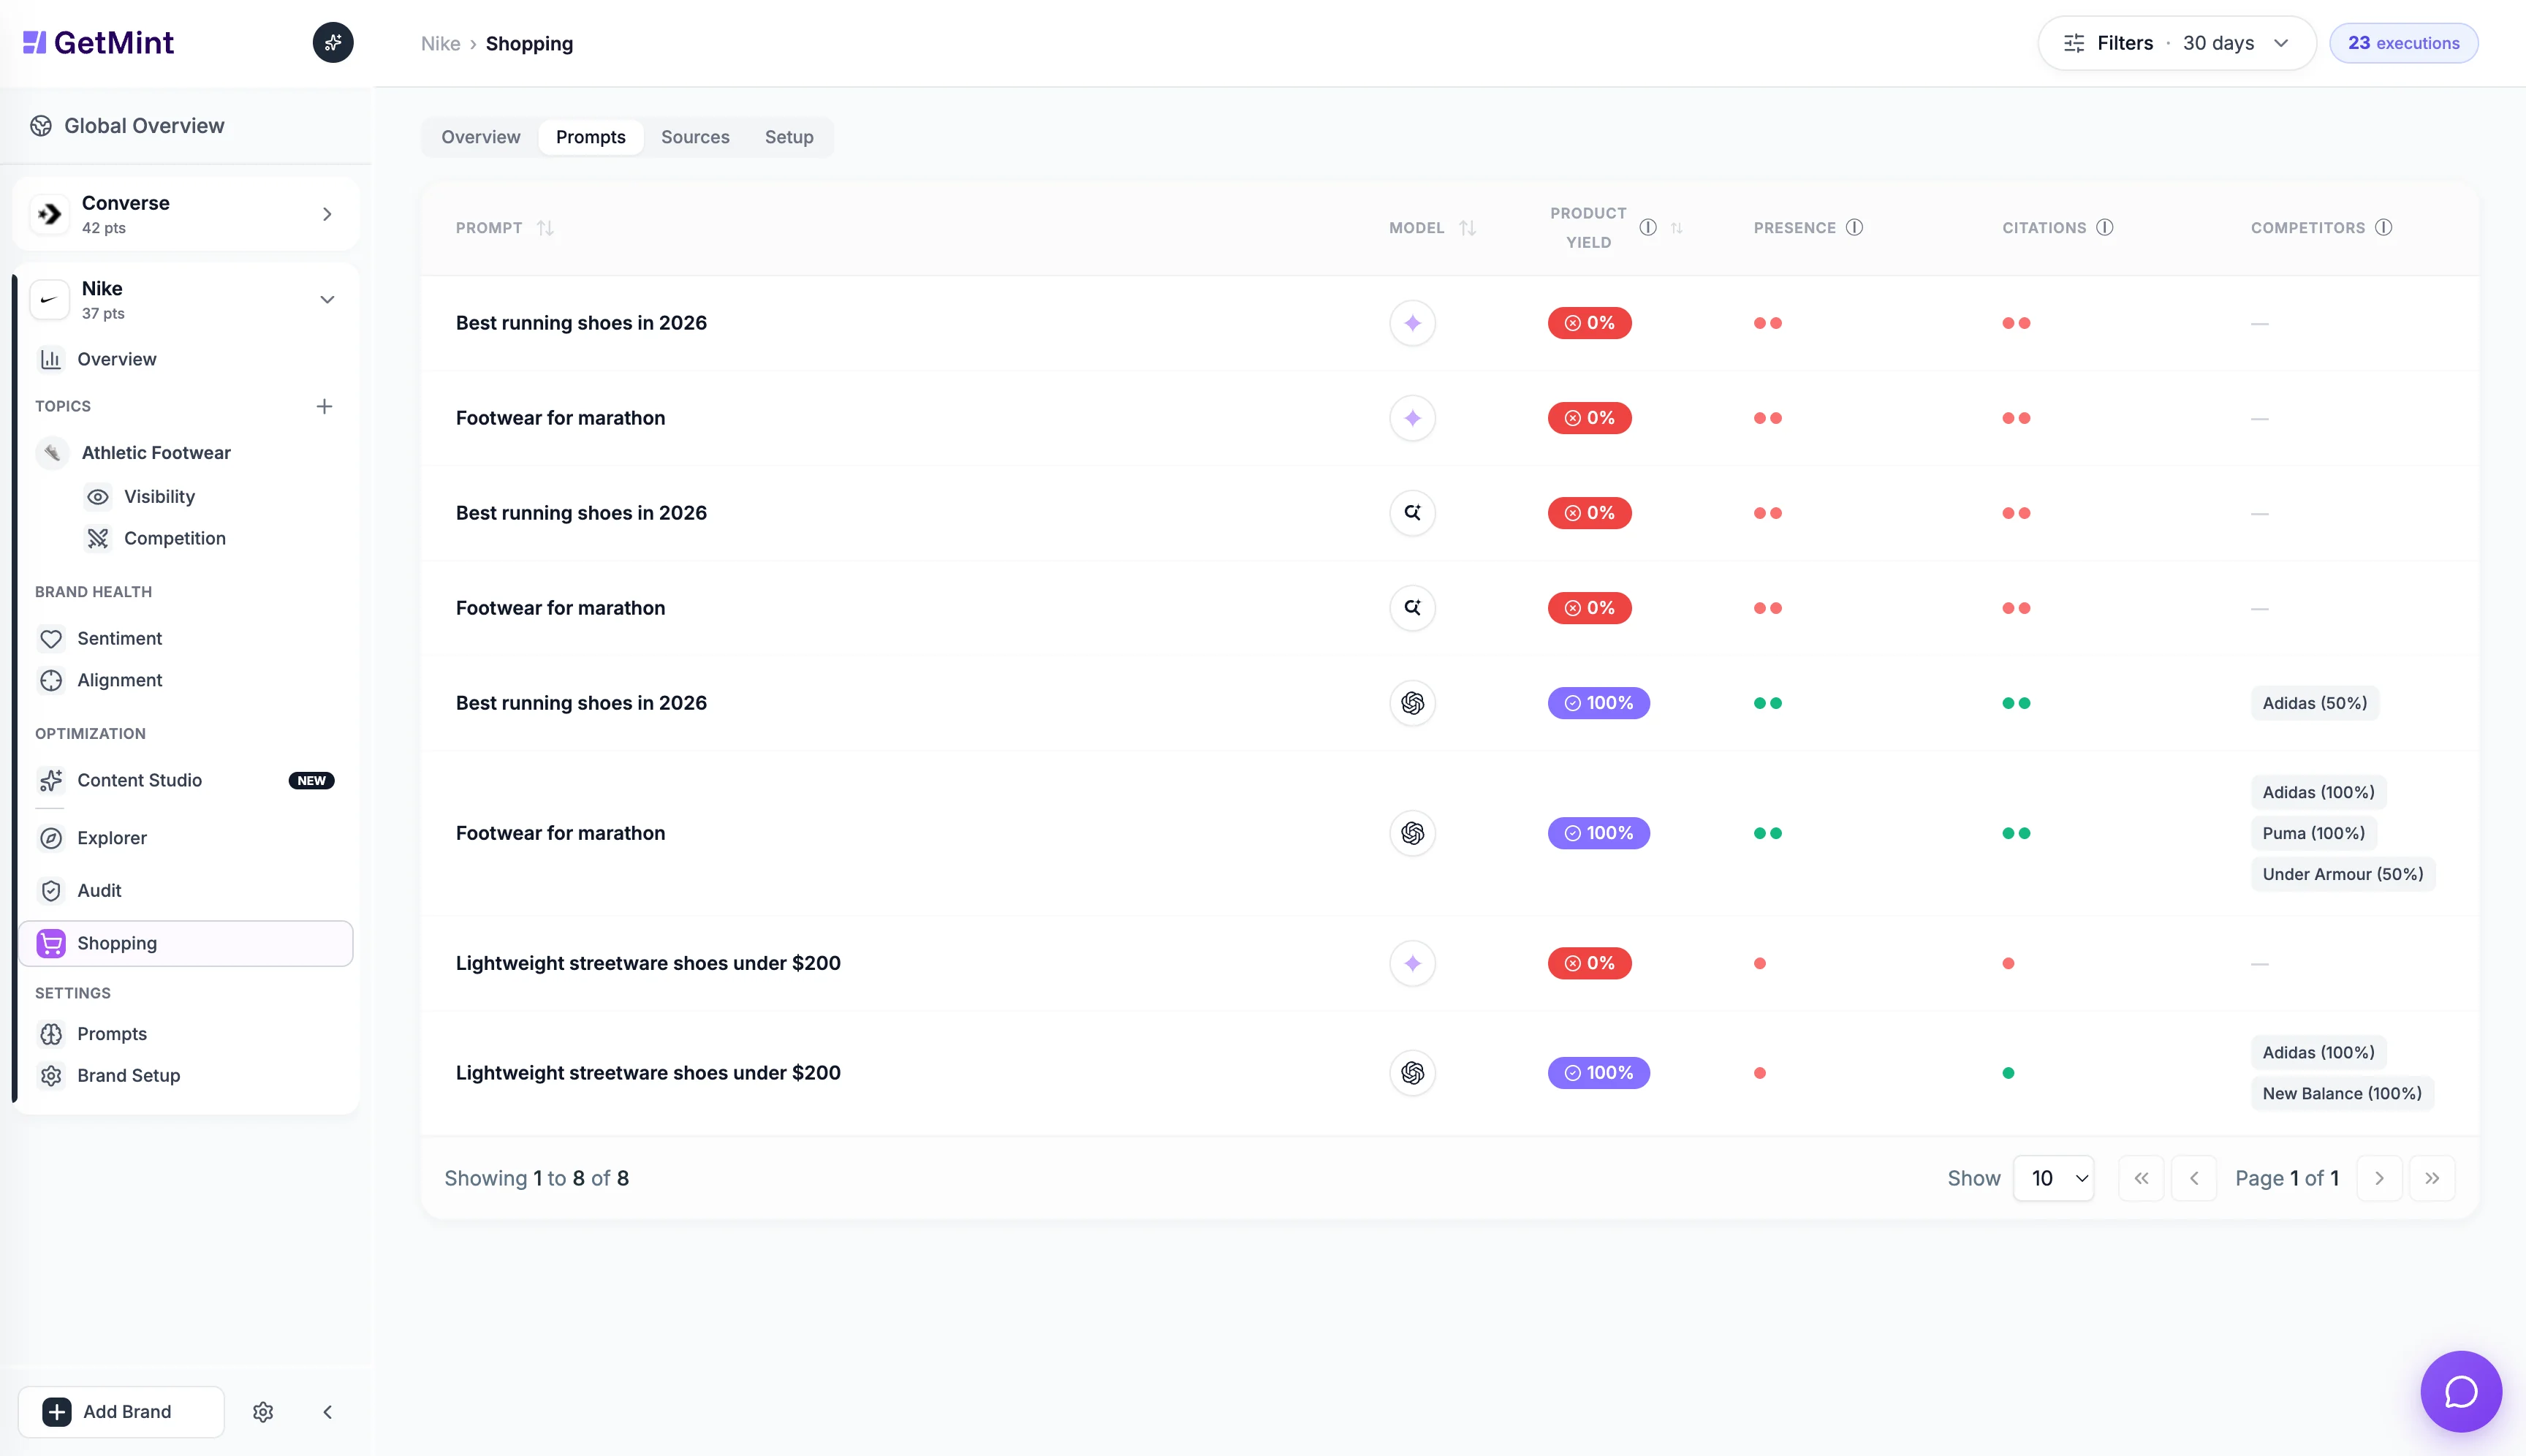
- Product Yield — share of responses where the AI actually returned a shopping carousel (vs a text-only answer with no products). High Product Yield = the AI takes this prompt seriously as a buying question.
- Mentions — how often your brand is mentioned in the response.
- Responses — total runs in the selected period.
Step 4 — Track the Sources
The Sources tab tells you where the AI got its information.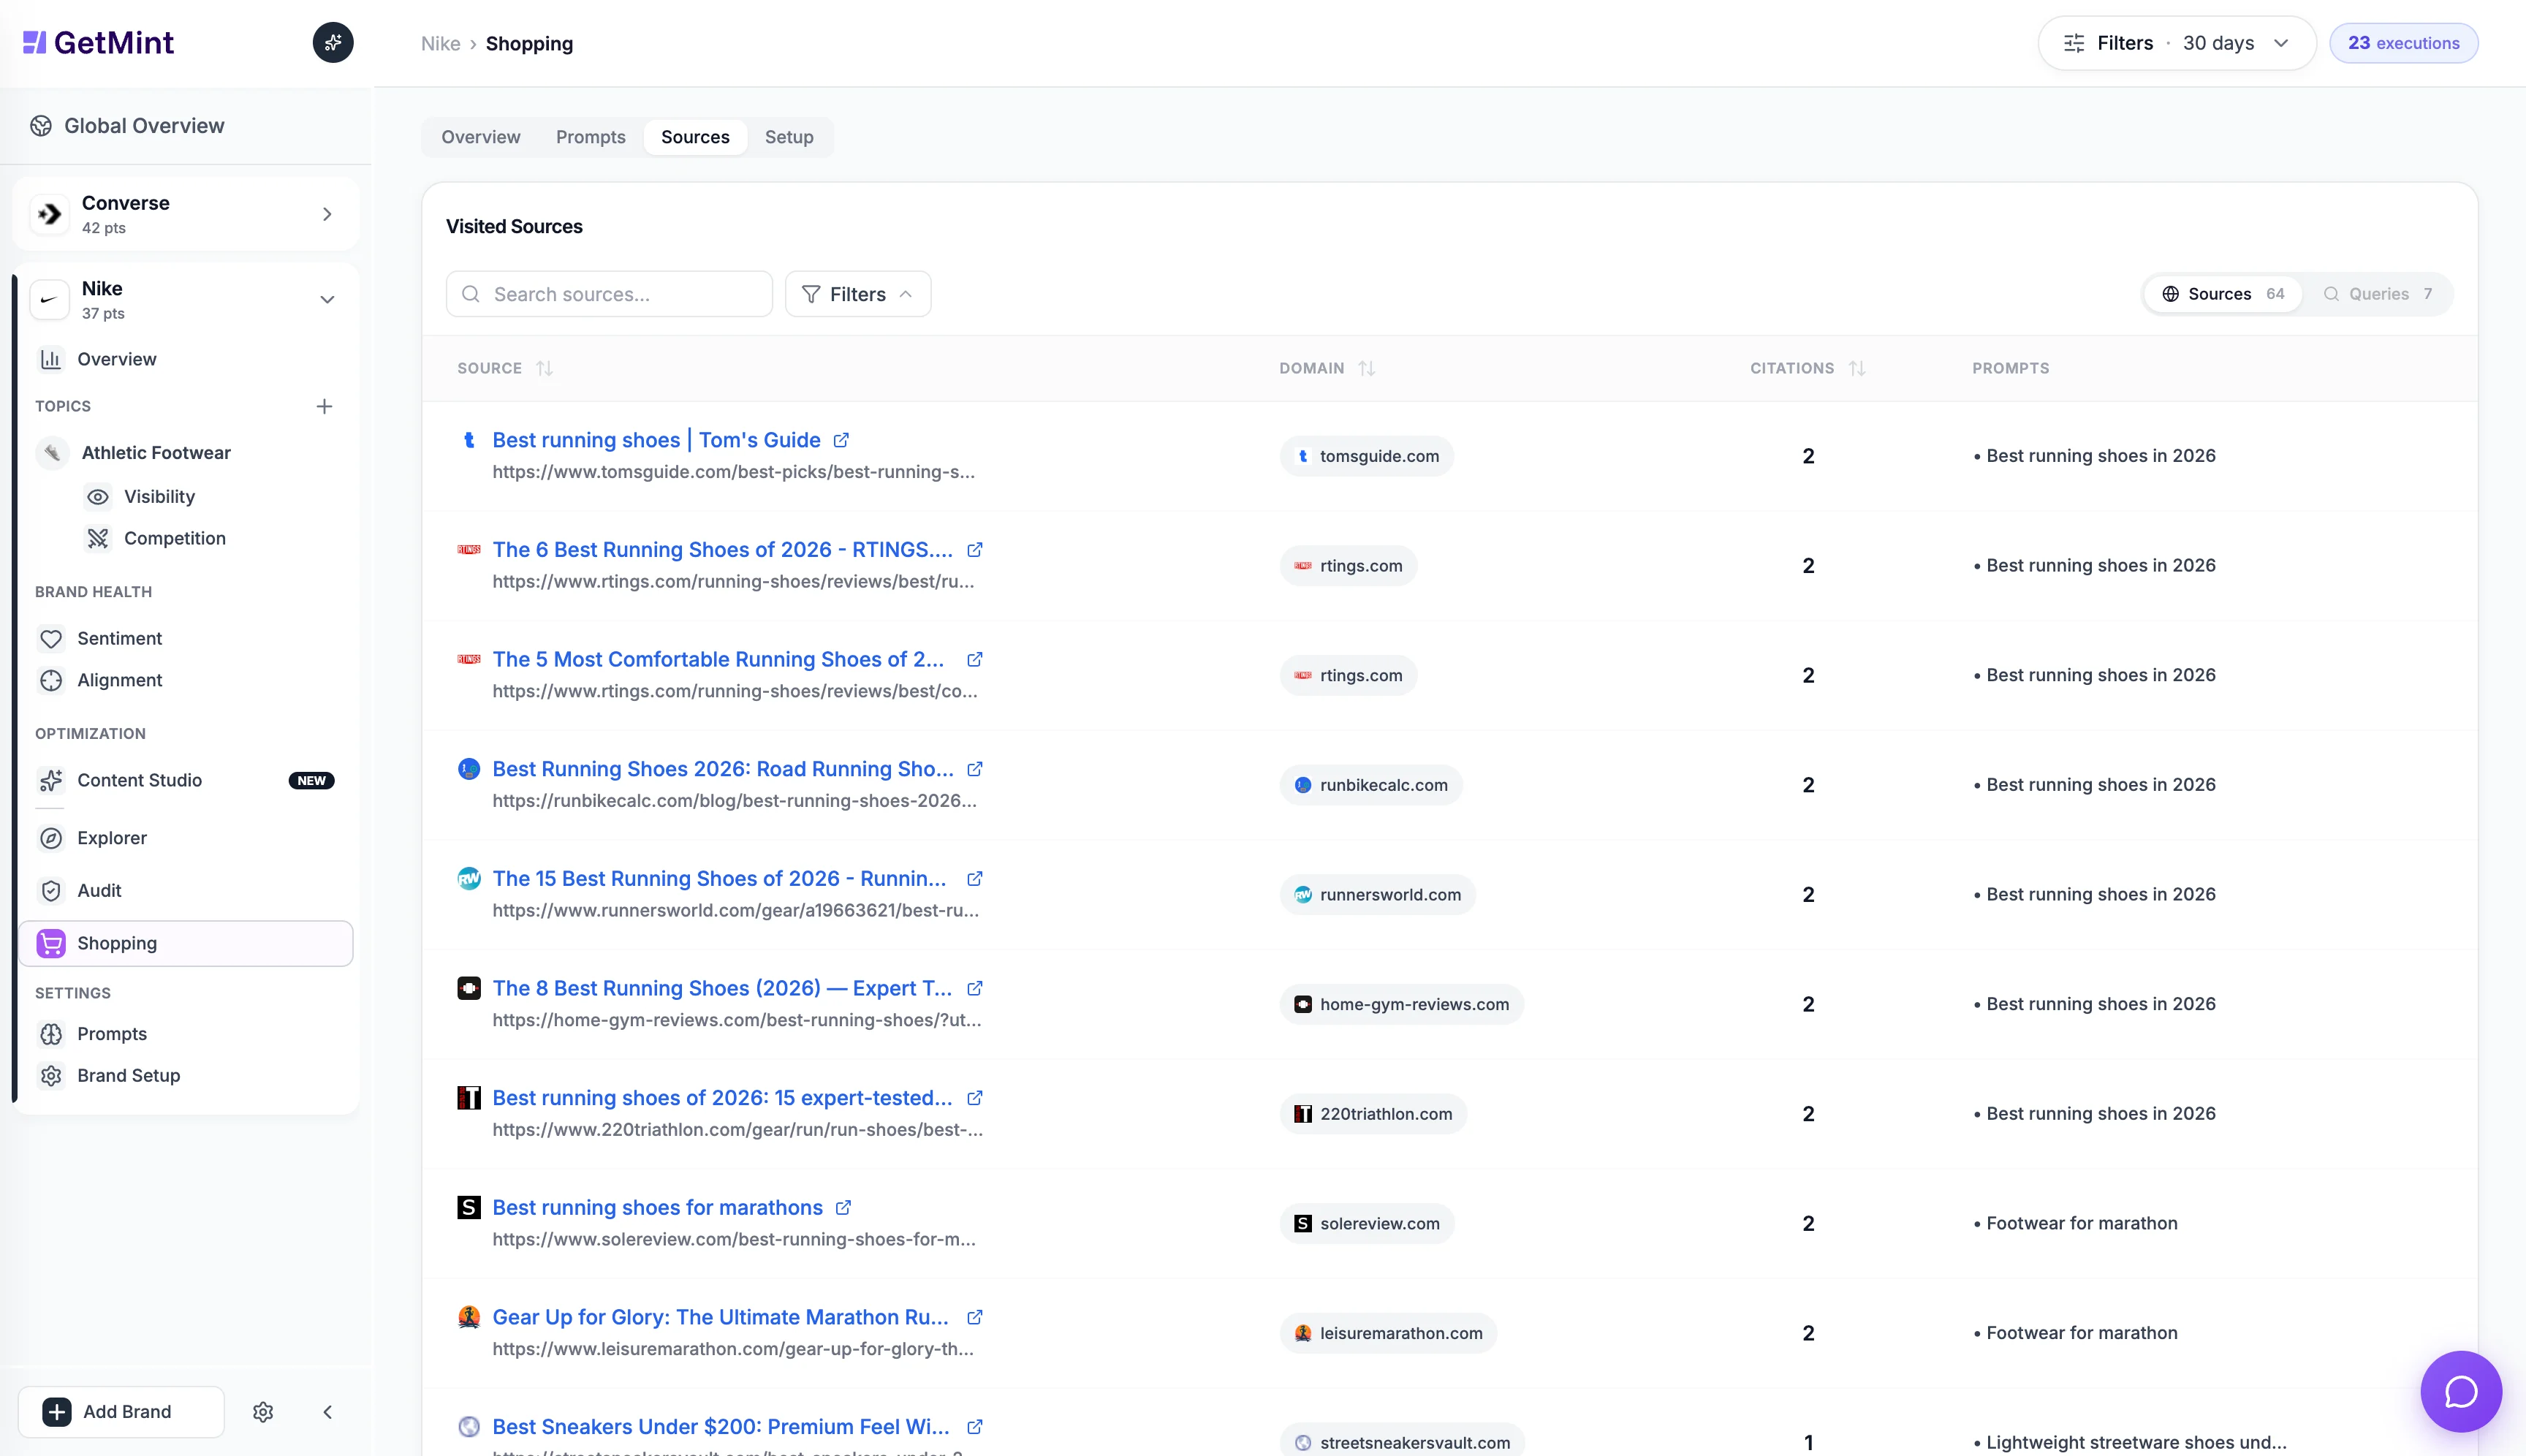
- Websites — third-party domains the AI cited ranked by frequency.
- Searches — the actual sub-queries the AI issued to the web before answering (web fan-out). These are gold for SEO: if ChatGPT searches “best marathon running shoes 2025 review” before answering, you want to rank for that query on Google too.
Step 5 — Manage everything in Setup
The Setup tab is the day-to-day cockpit for groups and prompts.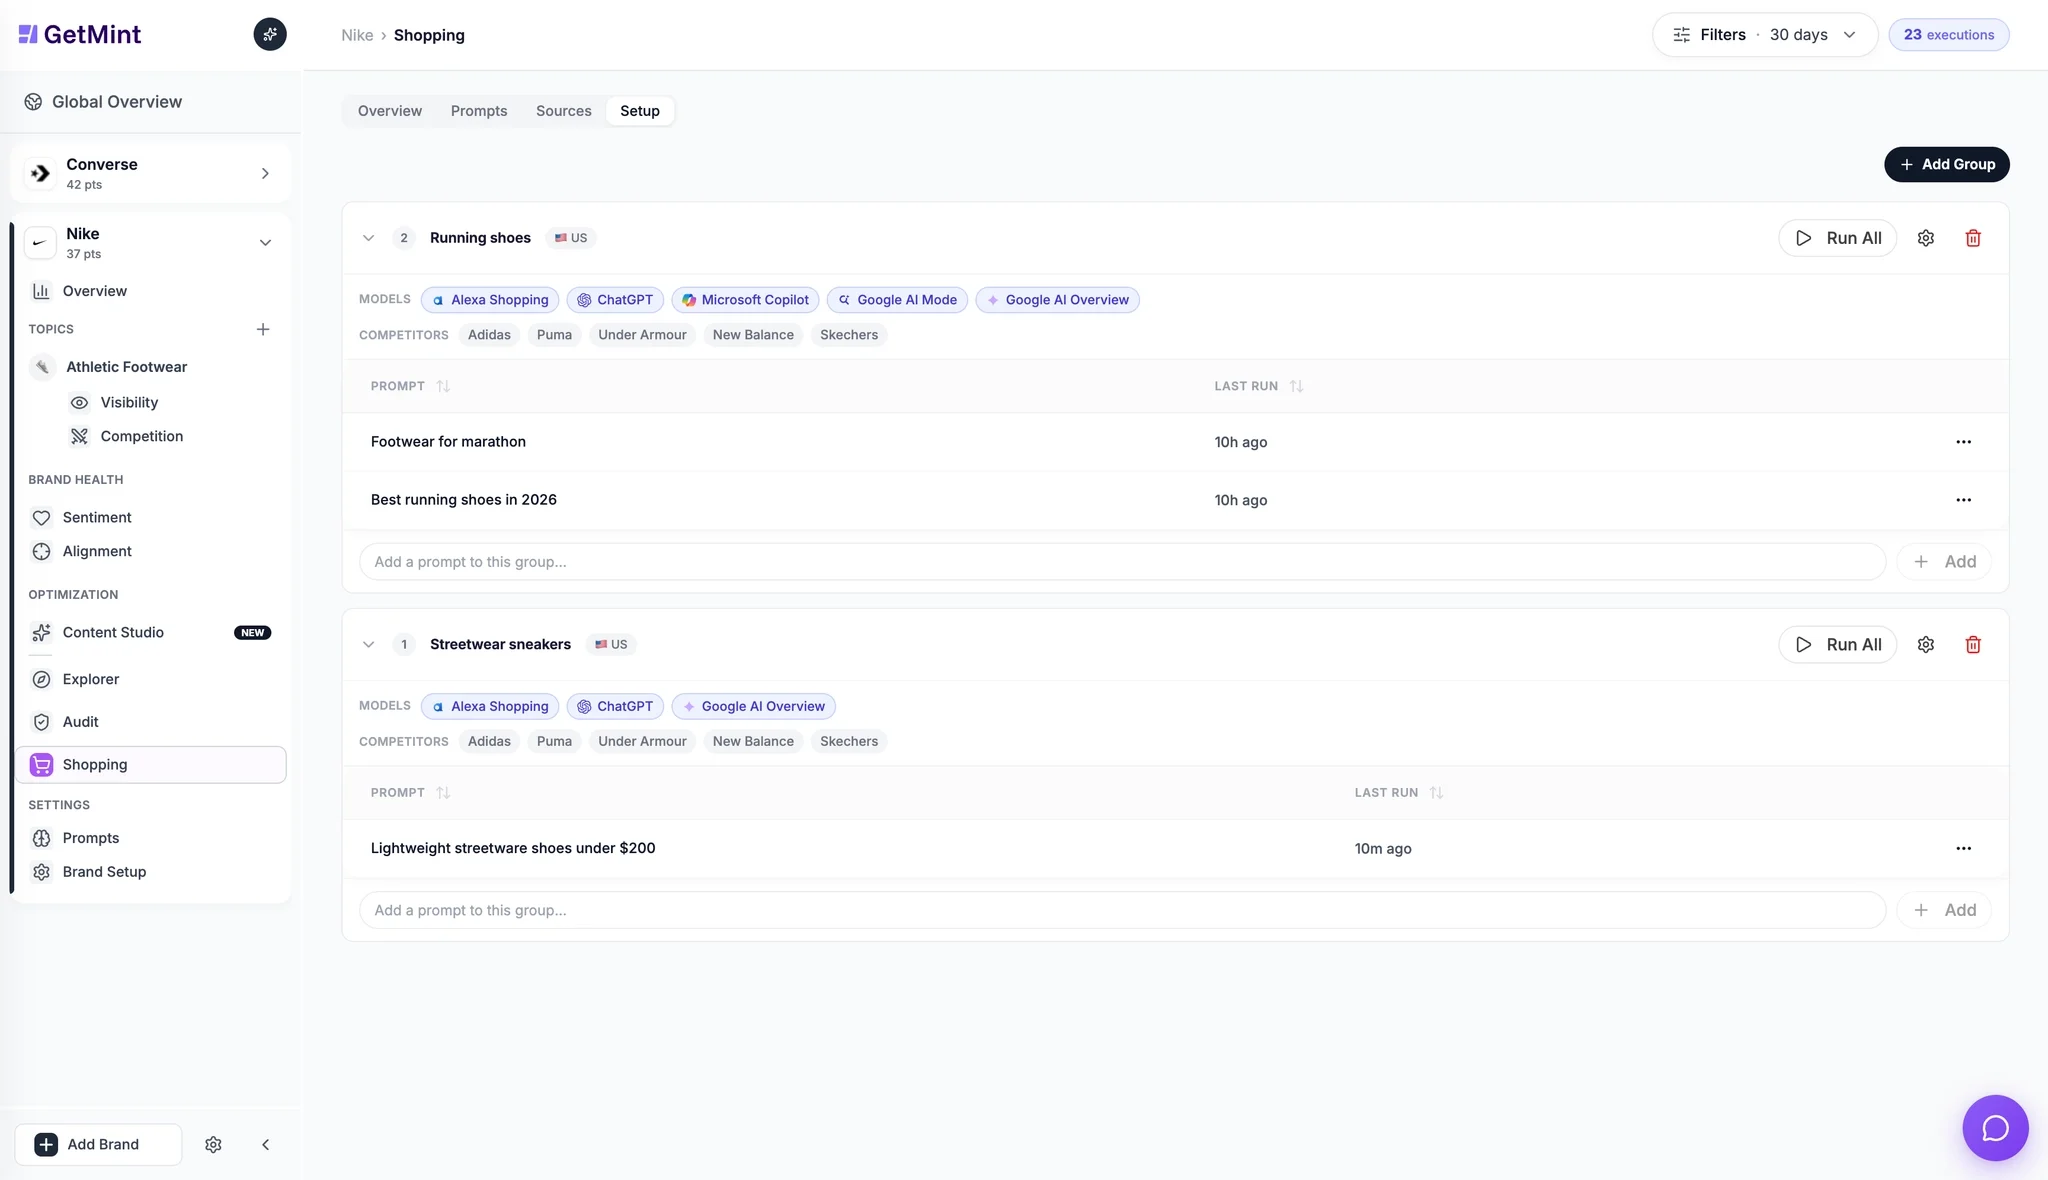
- See all your groups with their key metadata (market, models, prompt count).
- Edit a group (rename, change description, update market, change AI surfaces, edit competitors).
- Add a prompt inline to an existing group — without going back through the full wizard.
- Run a prompt manually to refresh data on demand.
Filters available everywhere
A persistent filter bar sits at the top of every tab.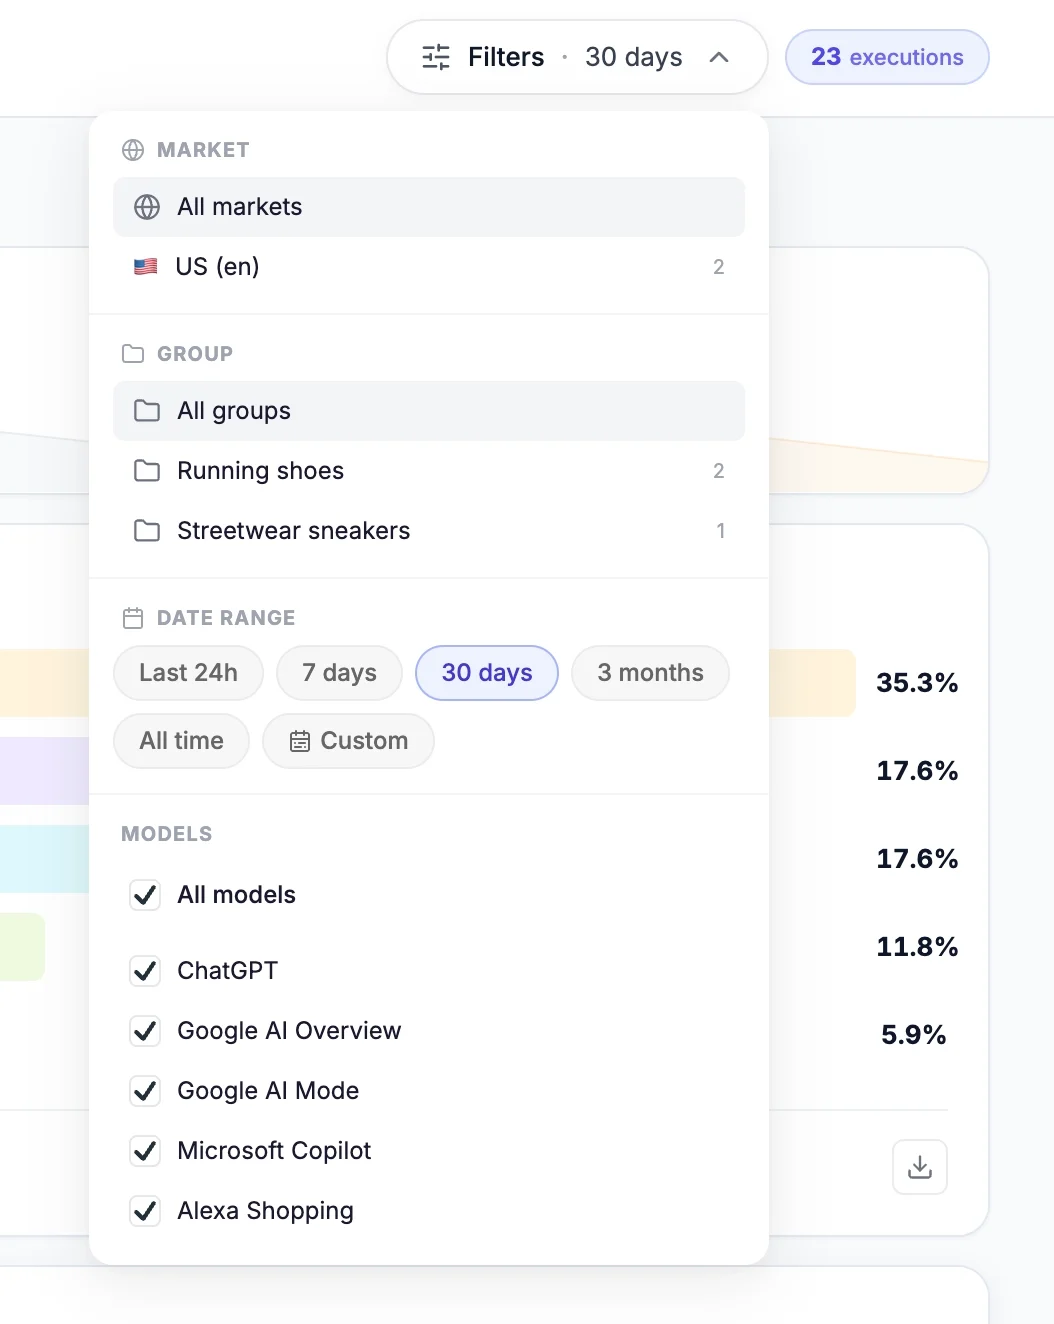
- Date range — last 7 days, last 30 days, custom range.
- Market — narrow to one country.
- Group — focus on one prompt group.
- AI surfaces (models) — show one, several, or all assistants.
- Granularity — daily, weekly or monthly buckets (Overview trend charts).
Reading the raw AI answer
Every row in every table links back to a Raw Results dialog: the exact AI answer GetMint captured for that prompt × model × date — full text, products mentioned, citations.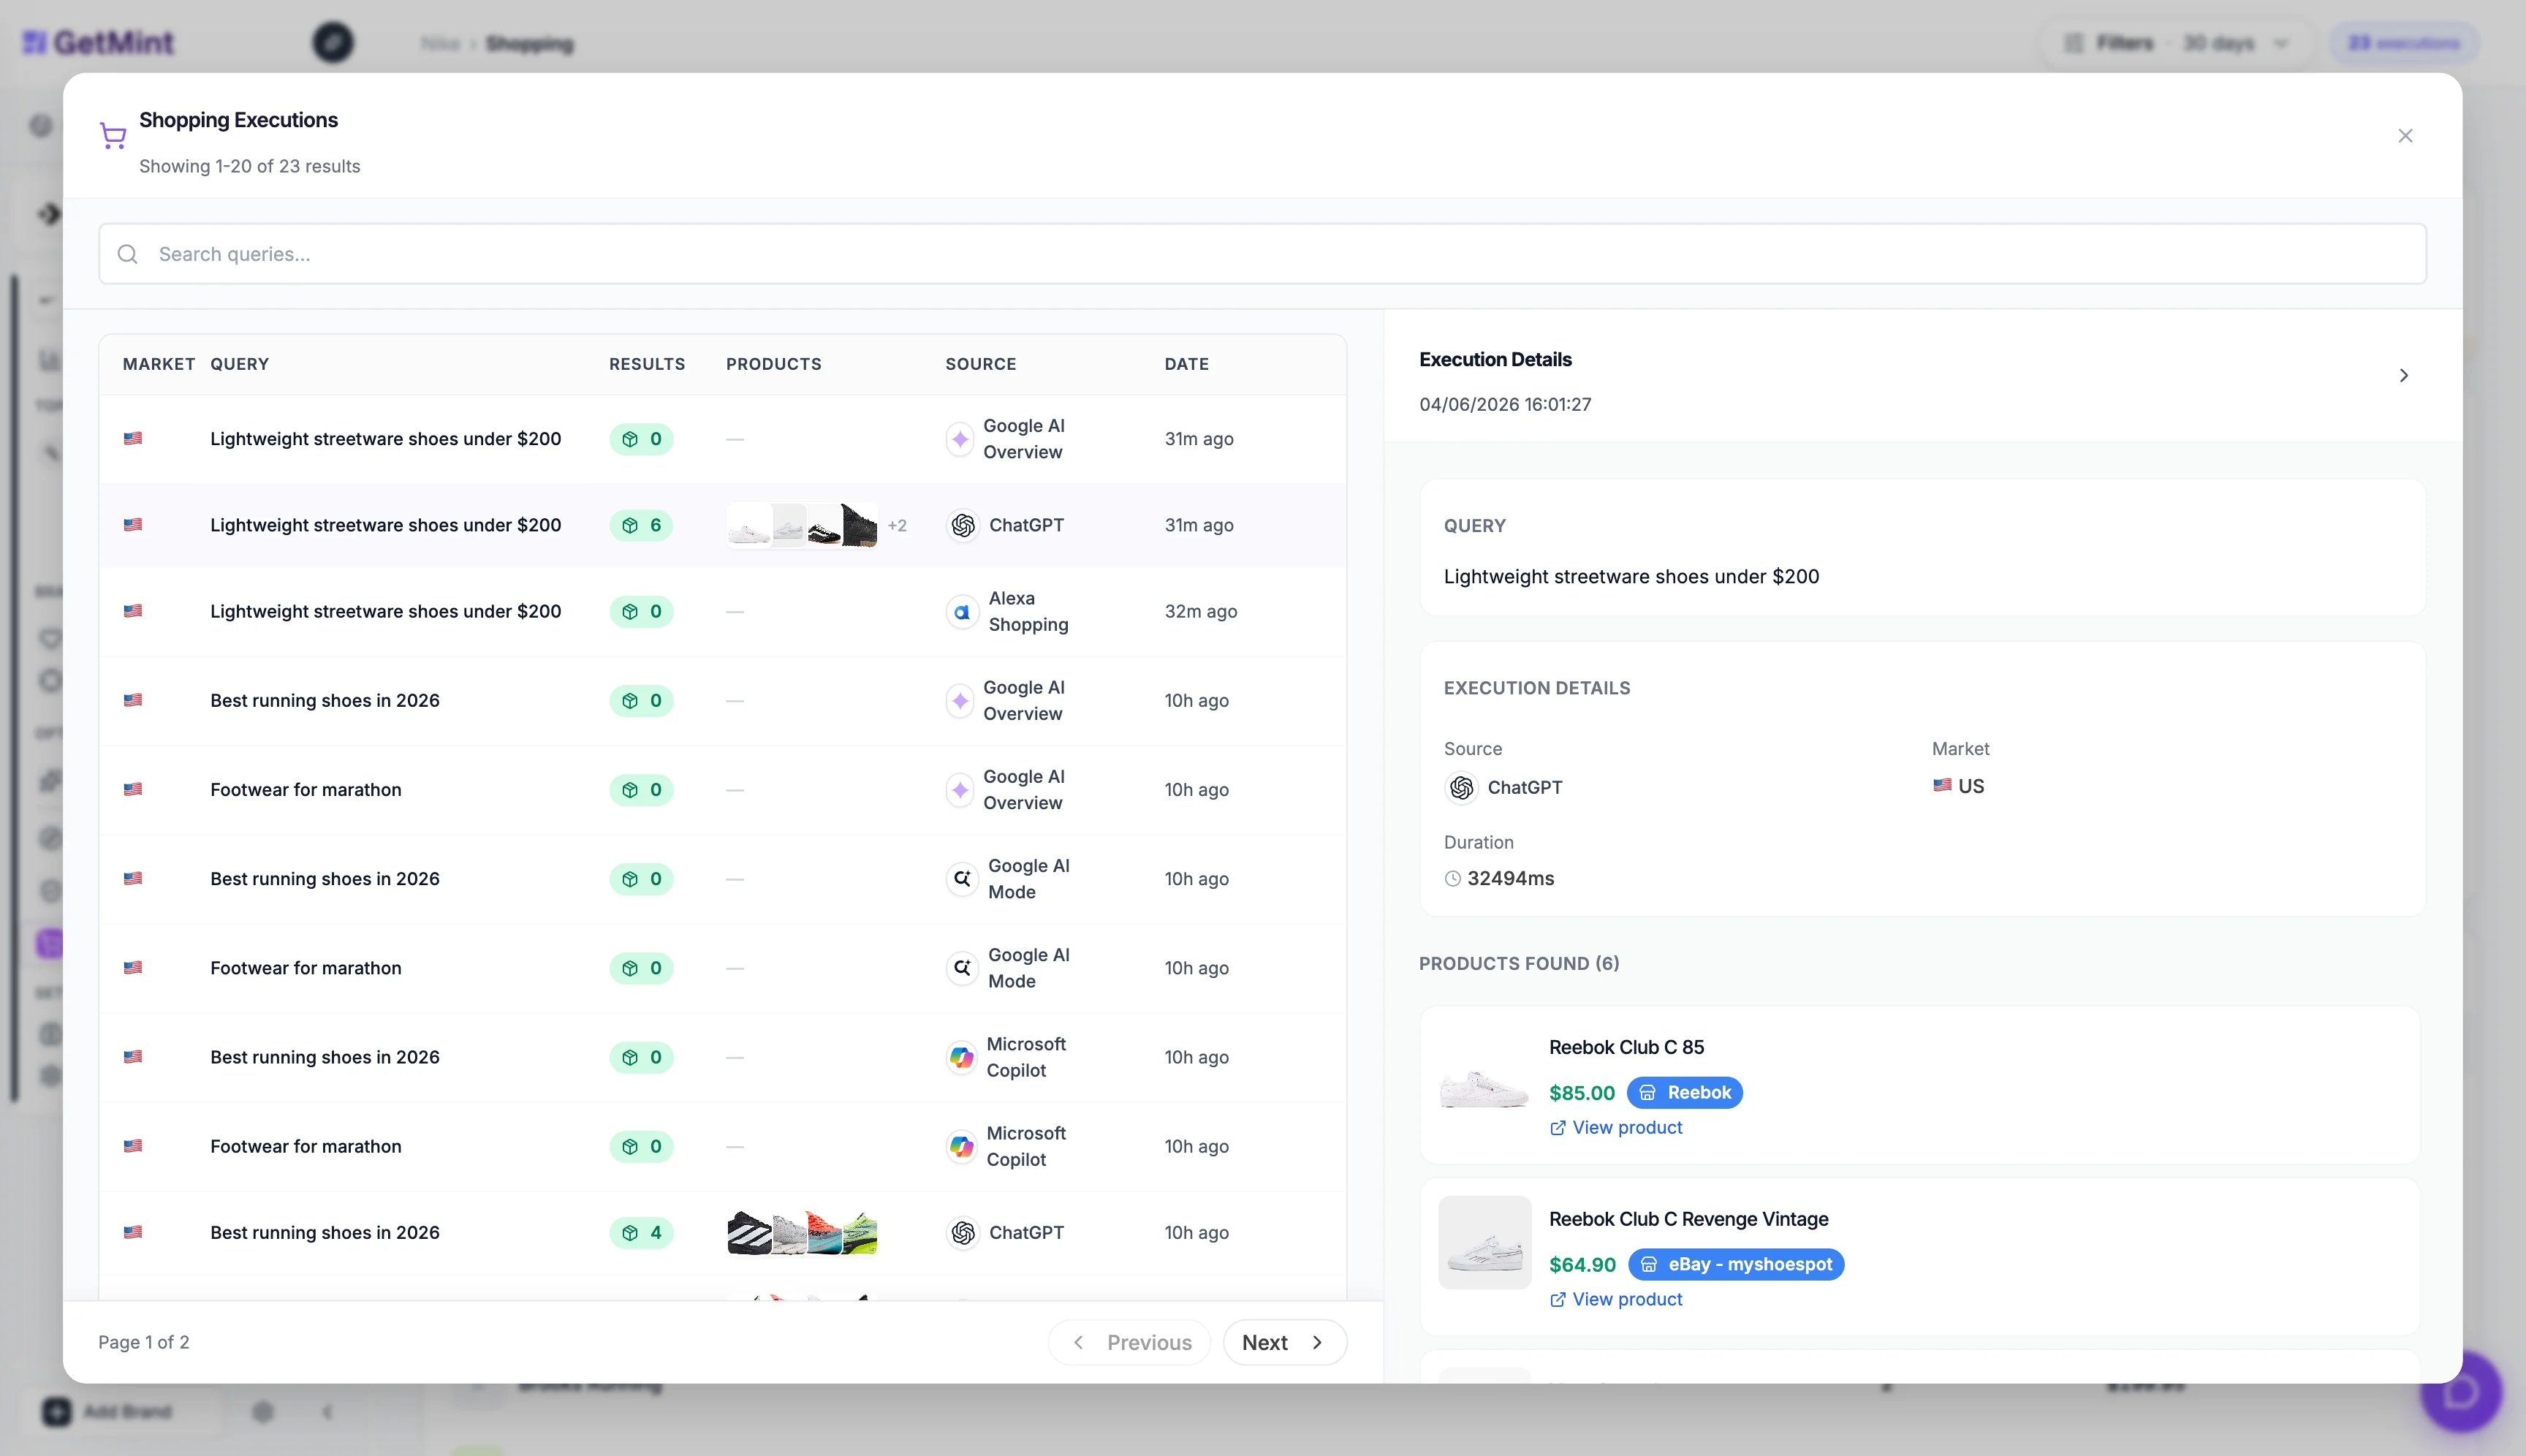
Key takeaways
- Shopping monitors 5 AI surfaces: ChatGPT, Google AI Overview, Google AI Mode, Microsoft Copilot, Amazon Alexa Shopping.
- Setup flow: Add Group wizard (Group → Prompts → Competitors → AI surfaces).
- Four tabs: Overview, Prompts, Sources, Setup.
- Competitors are first-class: declared once per group, surfaced everywhere downstream.
- New metrics: Share of Shelf, Product Yield, Top Merchants, Competitive Landscape.
- Filters apply across every tab and persist between sessions.
- Everything is read-only analytics.
The GetMint Team